Development and Evaluation of ASTE OTF
Schedule and items
- 2005 Jan 9--13
- Prepare observe tables for test observations
- Check if OTF and position switch observations work (since the COSMOS was modified)
- Reformed the reduction software (copied from the NRO45m system and made some modifications for ASTE)
- Jan 14--18
- modifications of aobs for OTF
- Check functionalities (confirmed that observation/data acquisition/reduction can be done)
- Bug fix
- Jan 19--27
- Measure antenna driving performance (measure amount of tracking error, determine approach/transient time)
- Check functionalities
- Bug fix
- Jan 28--Feb 4
- Test observations (comparison between OTF and position-switch) by Yamaguchi, Ikeda, et al.
Measurements of the antenna driving performance
The driving performance of the antenna was measured to check if it is driven stadily enough and to determine optimal durations for the approach-run and the transient-run (see Fig. 1).
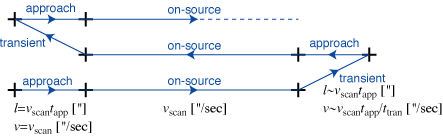
Fig. 1: schematic illustration of an OTF scan pattern.
Approach time, and tracking error during on-source scans
- Measurements and Analyses Az scans and El scans at (Az,El)=(180o,30o), (180o, 50o), (180o, 70o) were performed. Scan speed was set to 15, 25, 30, 50, and 100 ["/sec] on the sky. Since the data dump from the spectrometer is done at every 0.1 second, about 100"/sec (10"/0.1sec) is the maximum scan speed to accomplish the Nyquist sampling at 345 GHz. The measurements were done in a situation that the approach run begins after the antenna was stilled at the start point. Difference between the Prog and Real values are obtained from the antenna log file and plotted (FIg. 2).
- Results
- As time goes by, Prog-Real difference along both Az and El becomes nearly 0. Peak-to-peak deviation is typically 1" (Az) and 2--3" (El).
- Delay from starting approach run to beginning on-source tracking (Prog-Real becomes nearly 0) depends on the scan speed. Prog-Real becomes less than 1" in (typically) 2 seconds for the scan speed of 30"/sec, and 3 seconds for 100"/sec.
- Conclusions
- The antenna is driven steadily enough for 345 GHz OTF observations (1" in Az, 3" in El peak-to-peak).
- We recommend to set the approach time to 4 seconds (3 seconds might be enough for slow scans).
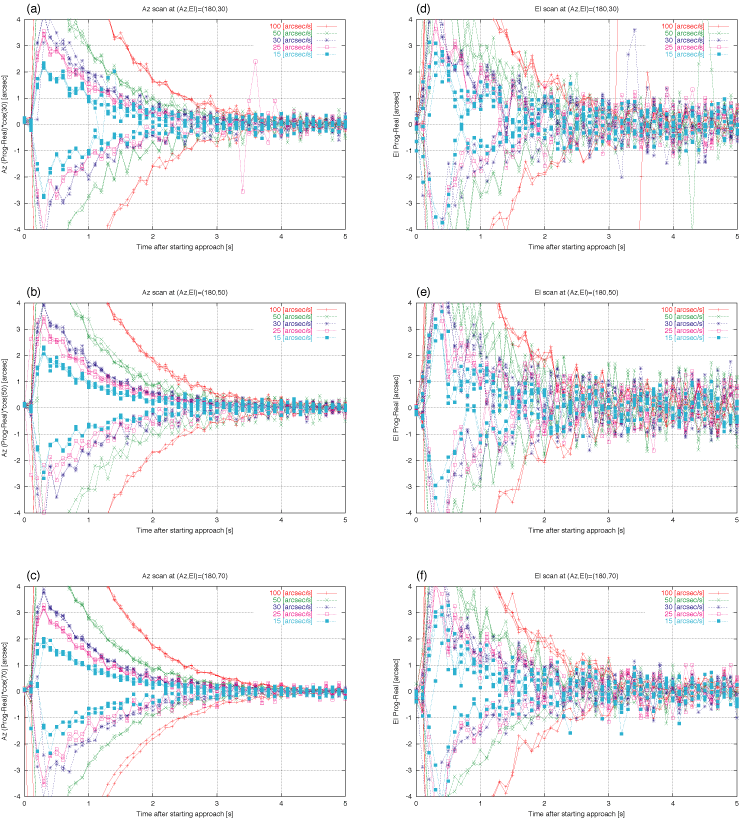
Fig. 2:
Difference between Prog and Real values (Y-axis) against
the time after start of approach (X-axis).
4 Az/El-increasing scans and 2 Az/El-decreasing scans are overplotted.
For the cases of
(a) Az scan at (Az,El)=(180o,30o),
(b) Az scan at (Az,El)=(180o,50o),
(c) Az scan at (Az,El)=(180o,70o),
(d) El scan at (Az,El)=(180o,30o),
(e) El scan at (Az,El)=(180o,50o),
(f) El scan at (Az,El)=(180o,70o).
Transient time
- Measurements and Analyses OTF observations of an object whose Declination is about 0o were performed. The approach time was set to 4 seconds. For 3 sets of scan speed vscan and transient time ttran --- (vscan,ttran) = (30 ["/sec],2 [sec]), (60 ["/sec],2 [sec]), and (100 ["/sec],2 [sec]) --- we checked whether the antenna Real position catches up the Prog position during the approach time (Fig. 3). Prog position of the antenna was driven to the start position of the next approach run within the transient time, and then approach run starts immediately.
- Results
- For the 2 cases with the transient time of 2 sec, Real position catches up the Prog position in 2--3 seconds during the approach (Fig. 3a,b).
- For the case of scan speed is 100"/sec and transient time is 1 sec, it took 3--4 seconds for the catch-up (Fig. 3c). For some position and scan direction, it is apprehended that Prog-Real does not become nearly 0 during the approach time ,4 secconds.
- Conclusion We recommend to set the transient time to 2 seconds.
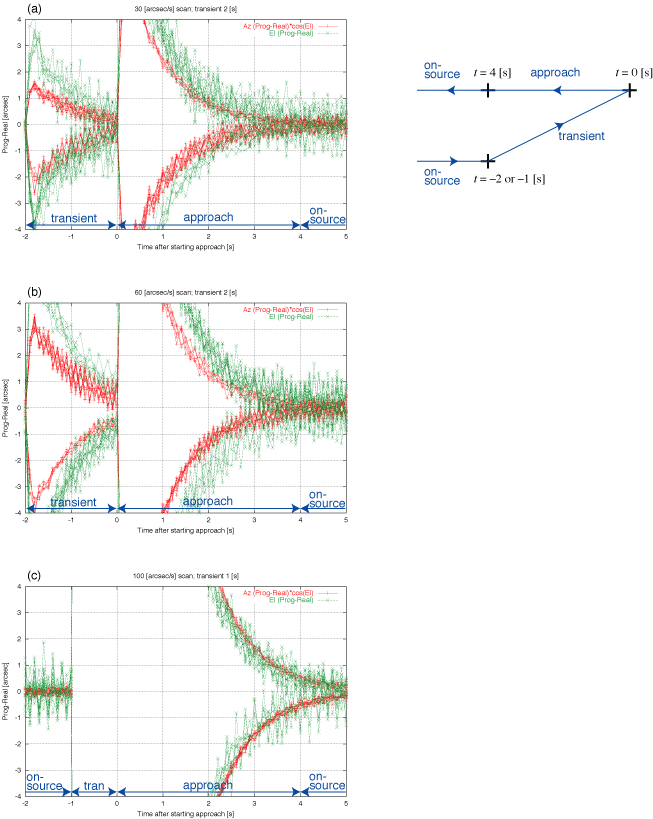
Fig. 3:
Difference between Prog and Real values (Y-axis) against
the time after start of approach (X-axis).
For the cases of (a) (vscan,ttran) =
(30 ["/sec], 2 [sec]),
(b) (60 ["/sec], 2 [sec]), and
(c) (100 ["/sec], 1 [sec]).
Software development
- aobs was modified to support OTF observations
- Reduction package was modified to be adapted to ASTE
Check functionalities
- Coordinate systems
- (RA,Dec), (l,b), and coordinates inclined from them by a specified position angle are available
- Solar system objects cannot be observed so far
- Spectrometers
- Using specified channel ranges, channel binning, 128 MHz/512 MHz modes, using not all 4 spectrometers, window functions (none, hann, hamm)
- Frequency-switch mode is under development
Current status
- Making observe table aobs has been modified to make OTF observe table. "OTF (raster)" mode is added to the Scan pattern, similar to continuum observations.
- Observations Run an observe table, just as normal observations. QLOOK is not implemented (it will be implemented in the next FY). Raw data are written in the directory /cosmos3/aste/raw/otfdata/GROUP/PROJ/ at the site. A spectrometer (1024ch) produces data of about 40MB/hr.
- Reduction The reduction package consists of command-line tasks made by Fujitsu and IDL GUI made by NRO/NAOJ. Data reduction can be done at the site, San Pedro, and the NRO. Functions like subtraction of baseline (poly/sin), flagging of bad data, and making map are implemented.
- Things to do
- Determine optimal parameters (maximum duration between OFFs, etc ...)
- Implement frequency-switch
- Confirm that multi-line observations work
- Develop the reduction package further
- Develop web pages
Bug fix
- Data acquisition timing was wrong
- The phase of 1PPS signal input to the ACG was inverted (integration started 500 msec earlier than expected) -> reconnected to the correct 1PPS signal
- After reconnecting to the correct 1PPS, the 1PPS signal was disturbed by the "START" call to the ACG. As a result, integration started several 100 msec earlier than expected. -> timing to call "START" was changed in order to evade the disturbance
- Sometimes coordinate values displaced by several arcsec along the RA (caused by slight time displacement between WS and ACU -> expand buffer)
- Coordinate values displaced by 1.5 points (150 msec) along the scan
- AZEL values which correspond to 100 msec earlier than expected was used to calculate RADEC values (100 msec)
- Coordinate values are calculated from the antenna position of integration start time, not the middle of integration (50 msec) -> corrected the merge program to use the average of integration start and end times. The data taken during this mission was not corrected for this 50 msec displacement (they are corrected when re-merged)
- Merge program sometimes crashed (dupulication of time occurred in the antenna log file)
- Sometimes coordinate values became wrong (when merge program read the log file which had not been flushed)
- The data was wrong during the last 1, 2, 3, and 4 seconds of a scan when the duration of the scan was respectively 10n+6, 10n+7, 10n+8, and 10n+9 seconds (there was a bug in buffer management operations)
- XY coordinates were not correct when map position angle was not 0
- Unexpected wait occurred after R, sky, and off data acquisition
- etc....