Determining parameters for OTF observations
Conceptual diagram of OTF scan
Figure 1 shows the scan patterns of OTF observations. In Figure 1, "on-source" represents the main scan (hereafter we call "scan"), where the antenna moves with a constant velocity, vscan, and records spectral data every tdump (0.1 sec for MAC, 0.2 sec for WHSF).
As in the case of position switch ("step-and-integration") observations, "chopper-wheel" calibration (R-SKY) data should be taken at the beginning and in the middle of observations. OFF position is observed every scan or several scans.
In order that the antenna points the specified direction stably during scans, "approach" comes before each scan. When an OFF position is not observed between scans (lower panel in Figure 1), "transit" is inserted between the end position and the start position. The above is the same as the continuum raster-scan observations. We recommend to set tapp = 4 sec for approach and ttran = 2 sec for transit.
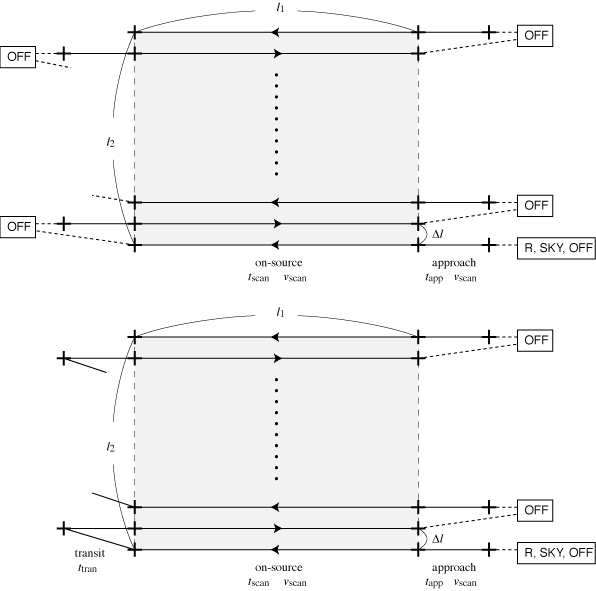
Figure 1: OTF scan pattern.
upper: Observing sequence "1*" (OFF-ON)
lower: Observing sequence "1**" (OFF-ON-ON).
Parameter determination and sensitivity estimate
The nominal observing efficiency increases with increase in t_scan (decrease in v_scan).
Parameters
- assuming the observing area of
l1 ["]
 l2 ["]
(l1 in the direction of scan and l2 in the vertical direction).
- When the time needed for a scan (on-source) is
tscan [s], the scan velocity in the sky is
vscan ["/s] =
l1/tscan.
tscan should be set in order that the antenna slew length during the integration time tdump [s] (0.1 sec for MAC and 0.2 for WHSF), tdumpvscan ["] does not exceed 1/3 or 1/4 of the beam width. For example, at 350 GHz, vscan 60 ["/s] for MAC and
vscan 30 ["/s] for WHSF.
- We assume the number of scans per OFF position is NscanSEQ, the spacing between scans is
 l ["], and the map grid size is
d ["]
d ["].
l is set to about 1/3 of the beam width, and d is set to from about 1/3 to 1/2 of the beam width (d can be changed to some extent when data reduction).
In this case, the number of scan is
Nrow =
l2/
l +1.
Sensitivity estimate
By using the setup above, the parameters are determined and the sensitivity is estimated as follows. (script for this is here: (otfaste.c / otfaste.pl).
- Overhead time for a scan tOH [s] is tOH = 6 + 8/NscanSEQ
- The integration time for OFF position is determined as follows:

where = 4.3
(note that this depends on the type of convolution function and parameters for map making. 4.3 for Bessel x Gauss, 1.2 for Sinc x Gauss, 6.3 for Gauss, 1.0 for Pillbox, and 10.2 for Spheroidal. Please see Sawada et al. 2008 for details.)
- Total observing time including OFF positions and antenna slew time is

where fcal is overhead time for R-SKY calibrations. When observing R-SKY for one minute per 15 minutes, fcal is 16/15. When tOBStot exceeds the time interval for pointings, observations are needed to be divided into multiple observing tables to reduce the observing time per observing table. - Total on-source scan time is

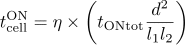
- Integration time for ON positions and OFF positions per 1 grid
(d d)
of the map is

- The rms noise temperature of the map is
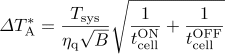
where Tsys [K] is the system noise temperature, B [Hz] is the frequency resolution of the map, andq is the quantization efficiency (0.88 for MAC and 0.64 for WHSF).
Hints for parameter selection
- The nominal observing efficiency increases with increase in tscan (decrease in vscan).
The upper limit on tscan is determined by the following two factors:
- data (baseline) degrades with increase in the time interval between ON and OFF positions
- map becomes non-uniform with increase in observing time to cover the entire map area
- The lower limit on tscan is determined by the condition that tdumpvscan ["] should not exceed 1/3 or 1/4 of the beam width to prevent the beam smearing.
- In map making, map is convolved with the width which corresponds to the grid size d. Therefore, if d is too small, the effective integration time (tcell) decreases, and the noise level increases. This causes oversampling because the angular resolution is determined by the telescope beam size. If d is too large, the effective angular resolution increases (Figure 2).
- Scanning in only one direction makes the scanning effect. Scanning in two directions that intersect at right angles and performing basket-weaving improve the scanning effect. The reduction software implements the method of PLAIT by Emerson & Gräve (1988). In case of scans with only one direction, the reduction software also implements the algorithm of PRESS by Sofue & Reich (1979).
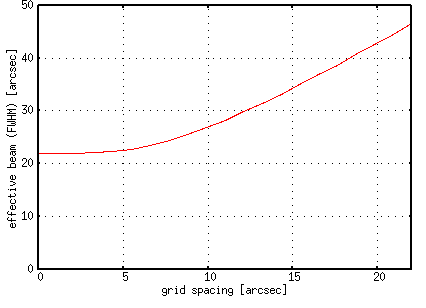
Figure 2: Effective beam width (FWHM) as a function of grid spacing d.
When d is small, the effective beam width is close to the telescope beam width (assuming a Gaussian with a FWHM of 22").
When d is large, the effective beam width becomes asymptotic to the width of the convolution function  2d.
Example
When using MAC with
l1=l2=300 ["]、
tscan=30 [s]、
l=7.5 ["]、
d=7.5 ["]、
Tsys(SSB)=500 [K]、
B=1 [MHz]
% perl otfaste.pl.txt
### OTF sensitivity estimation for ASTE ###
backend type                            (1:MAC, 2:WHSF): 1
length of mapping area (along the scans)    l1 [arcsec]: 300
length of mapping area (perp. to the scans) l2 [arcsec]: 300
time for scan                                 tscan [s]: 30
number of ONs per OFF                        Nscan(SEQ): 1
separation between scans              (delta)l [arcsec]: 7.5
map grid                                     d [arcsec]: 7.5
system noise temperature                       Tsys [K]: 500
resolution bandwidth                            B [kHz]: 1000
----------------------------------------------------------------
vscan=10.0["/sec] (1.0" per 0.1s sample)
tOFF=12.1[s] -> 12[s]
tOH=14.0[s]
ttot(ON)=20.5[min]
ttot(OBS)=40.8[min]
eta(ON/OBS)=0.50
tcell(ON)=3.31[s]
tcell(OFF)=12.00[s]
dTa*=0.35[K]
The optimum integration time for OFF position is 12 sec,
TA*=0.35 [K]
with the observing time of 40 minutes, and the effective angular resolution is 24".
# Tips: Redirection by using a parameter file (otfaste_input.txt) perl otfaste.pl.txt < otfaste_input.txt is easer for recalculations.